< 

 Lazy Digitize 

 > 


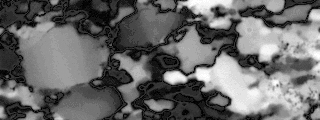
micrograph of quartzite with crossed polarizers


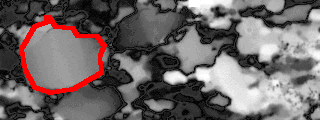
grain map


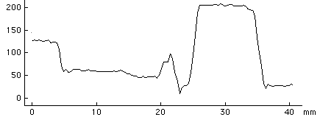
x-y plot


INTRODUCTION

The purpose of this very simple macro is to digitize lines such as

  • outlines of grains,
  • traces of (contact) areas, or
  • coordinates from an x-y plot


The input images may be

  • original micrographs or photographs,
  • bitmaps of segmented micrographs, or
  • x-y plots (x-y axes horizontal and vertical)


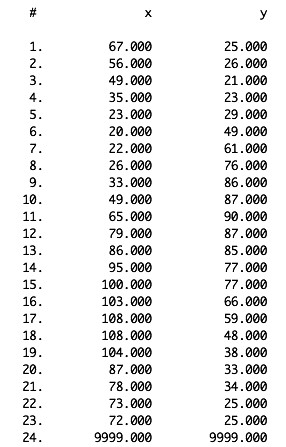
The digitized (vertex) points are stored in a text file.


GETTING STARTED

Open the image or plot file and load the Lazy Digitize macro.


DIGITIZING POINTS

To digitize individual points, such as outlines of grains, open the image - if necessary enlarge it such that there is a better spatial resolution. Make sure to reset the measurement file (in the Analyze menu).

Place the cursor on the first point of a given outline and press [1], move to the next point, press [1] again, etc. until the outline is completed.

In order to create a separator coordinate, press [2] - the value 9999 is stored.


DIGITIZING FROM BITMAPS

To digitize individual points, use same procedure as above.

As an additional option, use [3] to fille the area that has been digitized. In this manner it is easier to remember which grains have been digitized and which have not.


DIGITIZING X-Y PLOTS

Use x-y plots with horizontal and vertical axes. If a plot is scanned in an oblique orientation, you need to first rotate it back to horizontal.

Select macro [4].

You are first asked to calibrate the x- and y axis.

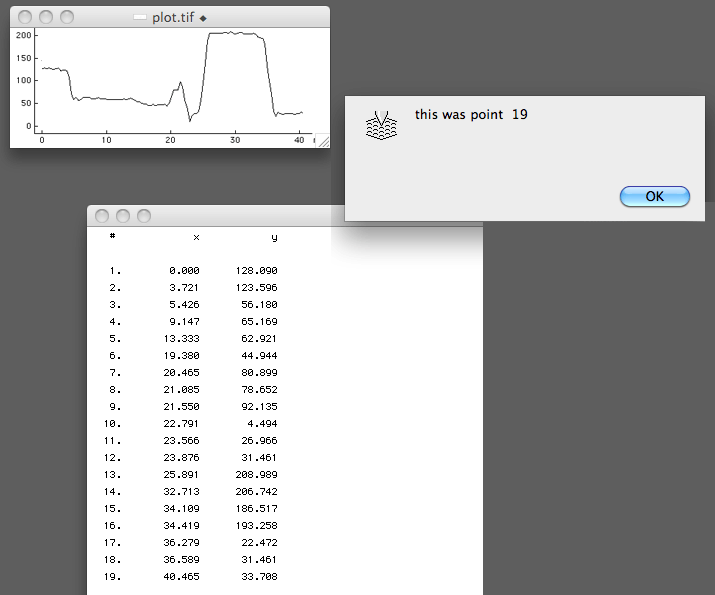
Next, you are to digitize the points on the curve.

To finish, select a point left of the image (where x < 0).

The result is a text file with the scaled and calibrated coordinates.