< |
Lazy D-map |
> |
|||
|
|
|
INTRODUCTIONThe purpose of the Lazy D-Map
macro is to visualize the spatial distribution of the D-value of the grain size distribution (GSD)
such as occur in fragmented rocks and fault gouge (see Heilbronner & Keulen, 2006).
The D-value is the (negative) slope of the GSD represented on a log-log plot of number (N) versus size (r).
In the context of fractal interpretations, the D-value is often called the "fractal dimension".
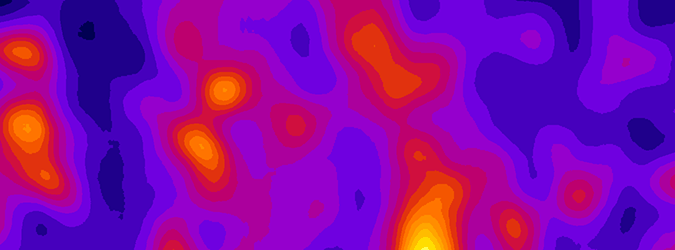
Using the Lazy D-map macro, it is possible to to map the distribution of D-values,
i.e., regions of different fragmentation intensity
References:
| ||
|
|
|
GETTING STARTEDThe object of this set of macros is
|
||
|
|
|
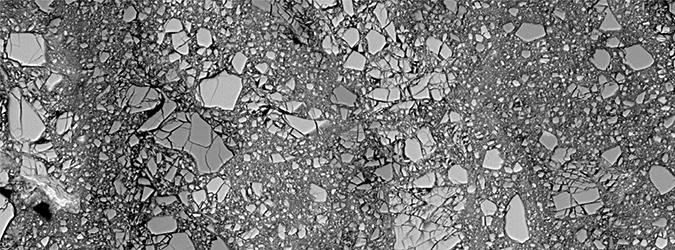
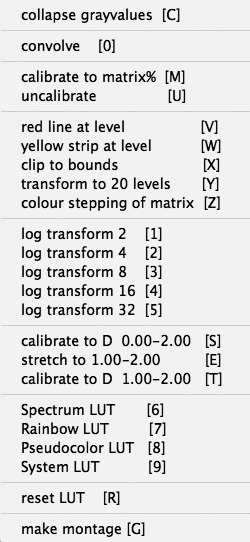
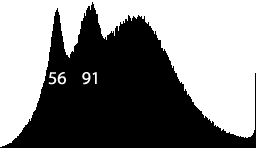
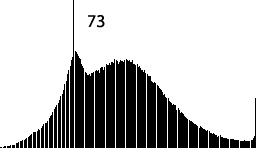
PREPARING THE IMAGEIf more than one phase is present on an SEM micrograph (such as the one shown here), the command [C] may be used to collapse the peak at GV=56 (K-feldspar) and the one at GV=90 (quartz and plagioclase) into one intermediate grey value (GV=73). This ensures that during the subsequent gray thresholding, fragment size does not depend on brightness of fragment. |
||
|
|
|
|
||
|
|
|
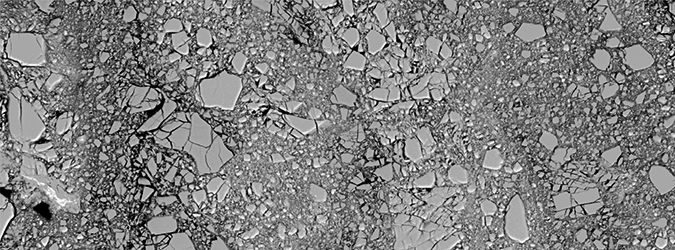
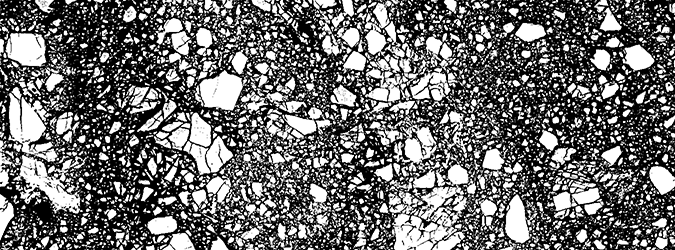
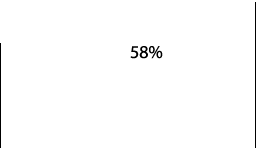
CREATING THE BITMAPUsing the Image SXM toolbox (with or without the Lazy Erode Dilate macro), the image is thresholded. The histogram indicates that 58% of the image are matrix (black pixels) |
||
|
|
|
CONVERTING TO MATRIX DENSITY MAPSUsing the command [0] the bitmap is smoothed using a Gauss filter. The radius of the filter can be adapted to the size of the bitmap |
||
|
|
|
|
||
|
|
|
CALIBRATION AND COLORINGUsing the command [M] the matrix density map is calibrated to 100%. Color stepping (command [Z]) may be used to color code matrix density |
||
|
|
|
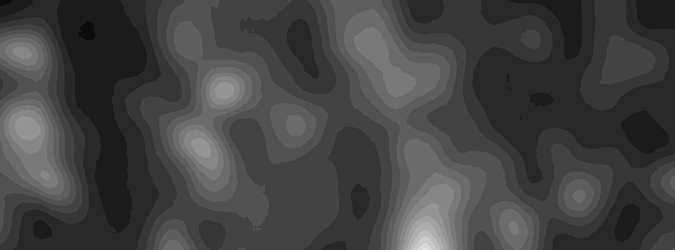
CONVERTING TO D-MAPSUsing one of the look-up tables ([1] to [5]) the matrix density map is visualized as D-map (0.00 ≤ D ≤ 2.00) where D is the slope of the log-log grain size distribution. After applying the LUT3, the D-values are stretched between 1.00 and 2.00 ([E]). Using [Y] 20 levels of D at interval of 0.05 ar shown. Other coloring schemes may be used, as shown, e.g., at beginning of this page. |
||
|
|
|
|
||

 Histogram of bitmap
