< 

 Lazy Pole 

 > 


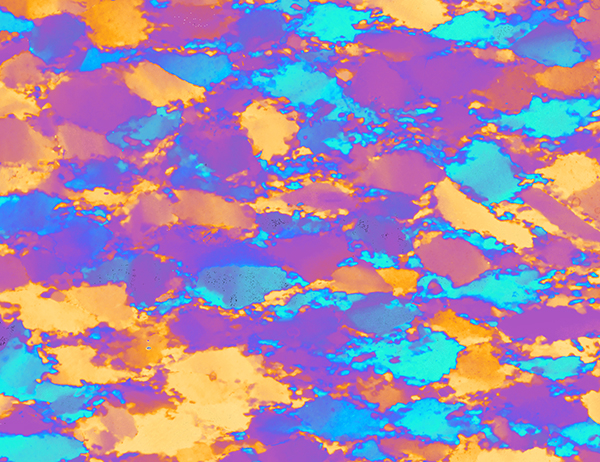
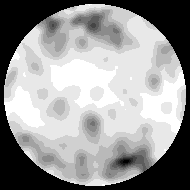
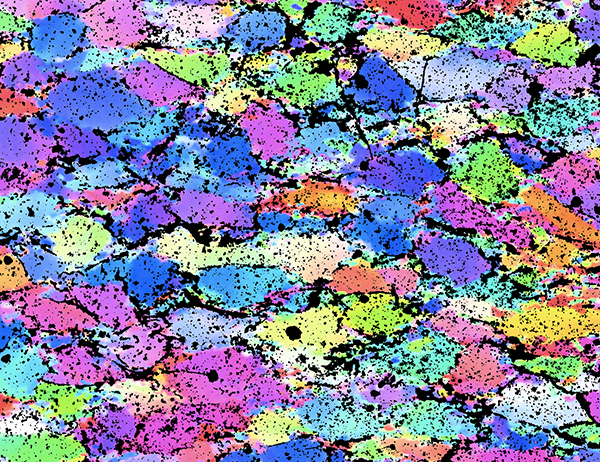
deformed quartzite


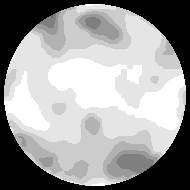
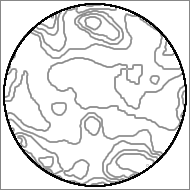
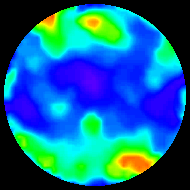
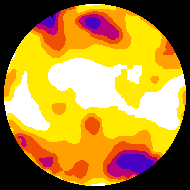
c-axis pole figure: max = 5.5, contours 1.0, 2.0, ...8.0


INTRODUCTION

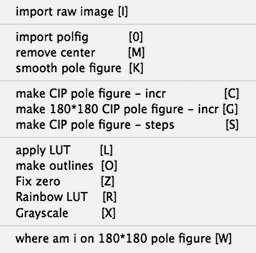
The commands of the Lazy Pole macro permit

  • the calculation of smoothed and enlarged pole figures from CIP POLFIG matrices,
  • the noise cleaning and removal of artefacts,

Input consists of 36 · 36 matrices of pole densities as calculated by the CIP software.


c-axis orientation image


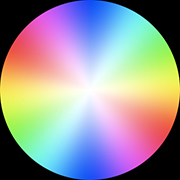
'Spectrum' color look-up table


References:

  1. Panozzo Heilbronner, R. and Pauli, C. (1993).
    Integrated spatial and orientation analysis of quartz c-axes by computer-aided microscopy. J. Struct. Geol., 15(3-5): 369-382.
  2. Heilbronner, R. (2000).
    Optical Orientation Imaging. In: M.W. Jessel and J.L. Urai (Editors), Stress, Strain and Structure, A volume in honour of W D Means. Volume 2, Journal of the Virtual Explorer.


GETTING STARTED

The object of this set of macros is to convert the 36 · 36 matrices of pole densities to enlarged, smoothed pole figures.

  • Start Image SXM
  • Load Lazy Pole macro (= text file)


CIP calculated pole density matrices (36 · 36) (5x enlarged)


PREPARING THE 36 · 36 MATRIX

From left to right:
 

  1. Using the command [0] the pole figure matrix is opened
  2. If necessary the command [M] can be used to remove a central artefact.
  3. The command [K] performs a noise cleaning (Median filter).


Note that y-axis of pole density matrix runs from top to bottom.


Pole figures (180 · 180) produced by Lazy Pole macro


CREATING 180 · 180 POLE FIGURES

[C] [G] and [S] may be used to create enlarged pole figures (upper hemisphere Schmidt projection)

  • [C]: intervals between contours are prescribed

  • [G]: same as [C] with extra smooth enlargement and fixed final size (180 · 180)

  • [S]: number of contour levels are prescribed


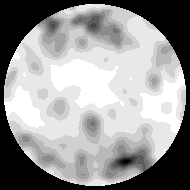
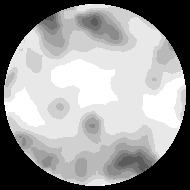
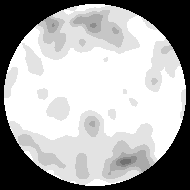
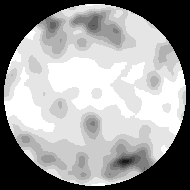
Pole figures of pole density matrices shown above (from left to right).

Measured pole figure maximum = 3.3 times uniform density (UD),

contour intervals = 0.25 UD,

12 contours from 0.25, 0.5, ... to 3.0 (= Pole figure maximum)


Note vertical flip w/r to density matrix


Pole figures (180 · 180) produced by Lazy Pole macro


OTHER CONTOUR SETTINGS

[G] is used to create enlarged pole figures (upper hemisphere Schmidt projection)

From left to right: Pole figures of pole density matrix shown above on left
 

  1. Pole figure maximum = 5.0, contour interval = 0.50,
  2. pole figure maximum = 3.3, contour interval = 0.30,
  3. pole figure maximum = 3.3, contour interval = 0.30

    (after Median filtering)


Note vertical flip w/r to density matrix


MODIFICATIONS

  • [L]: LUT is applied

  • [O]: Contour lines (after previous step, e.g., [G])

  • [F]: Fix zero (≈ Fix colors command of Image SXM)

  • [R]: Rainbow LUT (blue=low - red=high values)

  • [X]: Reset to Grayscale


From left to right:


  1. [O],
  2. [R] (with contrast stretching),
  3. combination of [L] and Fire-2 LUT


FIND ORIENTATION

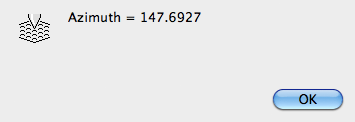
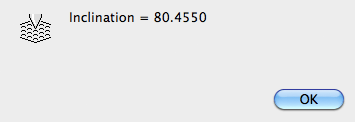
Invoking the command [W] while placing the cursor on the orientation of interest in the the pole figure, the values for azimuth and orientation are indicated.


The orientation given at left were obtained by placing the cursor in the lower right maximum (purple in the pole figure on right above)