< |
Lazy Grain Mapping
| > |
|
|
|
|
|
|
|
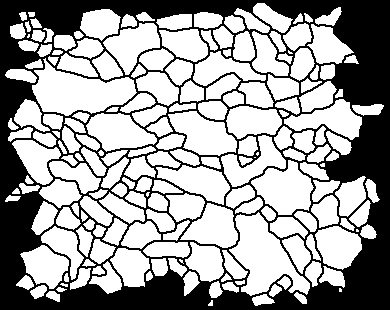
grain boundary map
|
|
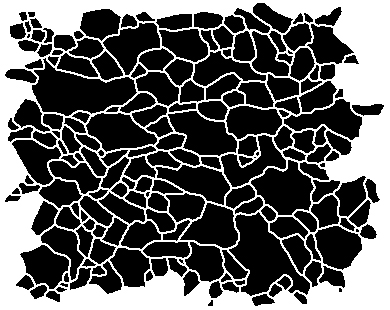
grain map = area map = INVERSE grain boundary map
|
|
|
|
|
|
|
|
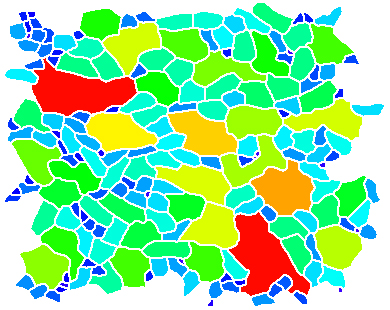
example of grain size map
|
|
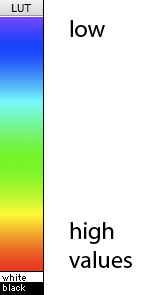
rainbow LUT
|
|
|
|
INTRODUCTION
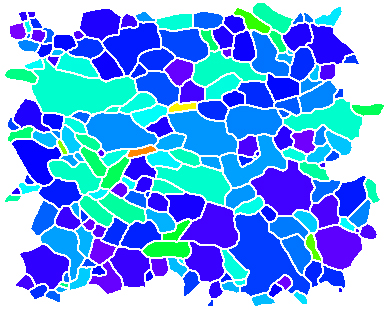
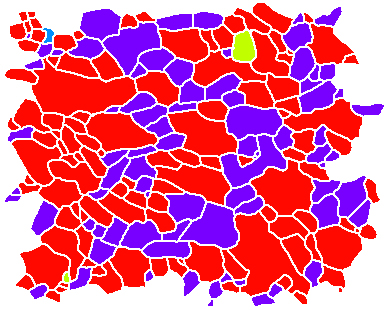
The purpose of the Lazy Grain Mapping is to color code grains according to grain size or grain shape.
The starting image is a bitmap showing cross sectional areas of a
segmented microstructure.
For each particle a number of shape or size descriptors are calculated and
the grains are color-coded according to the value of the descriptor.
The rainbow LUT is used to show high values of the respective descriptors
in RED and low values in BLUE.
In each case, it is possible to select a maximum value that is different from the measured maximum value.
In this manner the color contrast can be enhanced in the range of values that are of interest.
Values that fall outside the range of the LUT, i.e., below BLUE or above RED, are set to
BLUE or RED, respectively.
The resulting color maps are calibrated, i.e., the value of the selected descriptor
(size, shape, orientation) of any given grain can be read off by placing the cursor above the grain.
A histogram of the map shows the area weighted distribution of the descriptor.
Still, it is advisable to create a scale (LUT) and to note the selected limits.
It is, of course, possible to use other LUTs.
Note that the darkest BLUE of the rainbow LUT is actually purple.
|
|
|
|
|
GETTING STARTED
Load Lazy Grain Mapping macro.
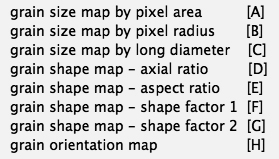
The following mappings can be carried out:
- 2D grain size: cross sectional area
- 2D grain size: radius of the area equivalent circle
- 2D grain size: long diameter (long axis of best fit ellipse)
- grain shape: axial ratio b/a: short/long axis of best fit ellipse
- grain shape: aspect ratio a/b: long/short axis of best fit ellipse
- shape factor 1: perimeter / perimeter of area equivalent circle
- shape factor 2: area / area of perimeter-equivalent circle
- grain orientation: orientation of long axis of best fit ellipse
|
|
|
|
|
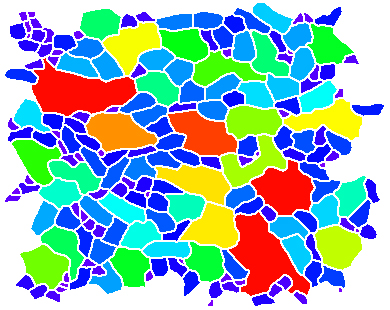
A - GRAIN SIZE BY CROSS SECTIONAL AREA
The grains are color-coded such that:
BLUE = smallest grains with area = 0 square pixel
GREEN = intermediate sizes with area ≈ 1500 square pixel
RED = largest grains with area ≥ 3000 square pixel
The measured maximum was 3363 square pixels.
|
|
|
|
|
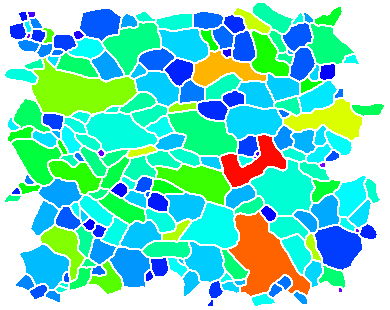
B - GRAIN SIZE BY EQUIVALENT RADIUS
The grains are color-coded such that:
BLUE = smallest grains with radius = 0 pixel
GREEN = intermediate sizes with radius ≈ 15 pixel
RED = largest grains with radius ≥ 30 pixel
The measured maximum was 32.72 pixels.
|
|
|
|
|
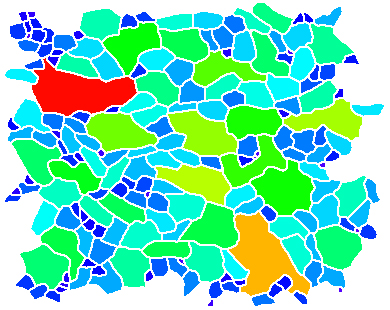
C - GRAIN SIZE BY LONG DIAMETER
The grains are color-coded such that:
BLUE = smallest grains with diameter = 0 pixel
GREEN = intermediate sizes with diameter ≈ 50 pixel
RED = largest grains with diameter ≥ 100 pixel
The measured maximum was 103.67 pixels.
|
|
|
|
|
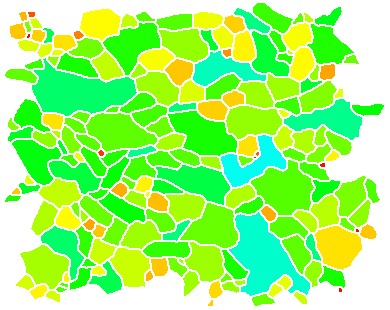
D - AXIAL RATIO (SHORT/LONG)
The grains are color-coded such that:
BLUE = grains with low axial ratio: b/a = 0.00 = lines
GREEN = grains with intermediate axial ratio: b/a = 0.50 = elongated grains
RED = grains with high axial ratio: b/a = 1.00 = round grains
The measured maximum was 0.95. The range of possible values is (0.00 ≤ b/a ≤ 1.00)
|
|
|
|
|
E - ASPECT RATIO (LONG/SHORT)
The grains are color-coded such that:
BLUE = grains with low aspect ratio: a/b = 1.00 = round grains
GREEN = grains with intermediate aspect ratio: a/b = 3.00 = elongated grains
RED = grains with high aspect ratio: a/b = 5.00 = more elongated grains
The measured maximum was 4.55. The range of possible values is (1.00 ≤ a/b ≤ ∞)
|
|
|
|
|
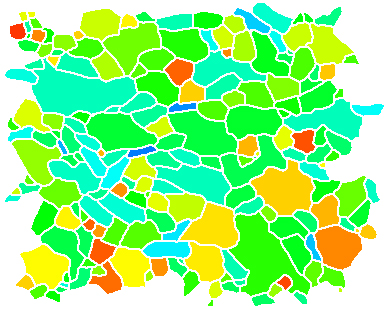
F - SHAPE FACTOR 1
This shape factor is calculated as the ratio between the measured perimeter divided by
the perimeter of the area-equivalent circle:
 
where A = measured area, P = measured perimeter (see Heilbronner and Barrett, 2013).
SF1 is a measure for "excess perimeter length".
This shape factor is also called "circularity"... (or "fractal dimension").
The grains are color-coded such that:
BLUE = grains with low shape factor: SF1 = 1.00 = smooth/round grains
GREEN = grains with intermediate shape factor SF1 = 1.35: slightly lobate/elongated grains
RED = grains with high shape factor: SF1 = 1.69 = lobate/elongated grains
The measured maximum was 1.69. The range of possible values is (1.00 ≤ SF1 ≤ ∞)
|
|
|
|
|
G - SHAPE FACTOR 2
This shape factor is calculated as the ratio between the measured area divided by
the area of the perimeter-equivalent circle:
 
where A = measured area, P = measured perimeter (see Heilbronner and Barrett, 2013)
SF2 is a measure for "defect area".
This shape factor is also called "solidity".
The grains are color-coded such that:
BLUE = grains with low shape factor: SF2 = 0.00 = infinitely lobate/elongated grains
GREEN = grains with intermediate shape factor SF2 = 0.50: lobate/elongated grains
RED = grains with high shape factor: SF2 = 1.00 = smooth/round grains
The measured maximum was 1.00. The range of possible values is (0.00 ≤ SF2 ≤ 1.00).
Note that very small grains (area < 12 square pixels) may produce values of SF2 > 1.00 - this is
an artefact, however, and the value is set to the theoretical maximum (1.00).
|
|
|
|
|
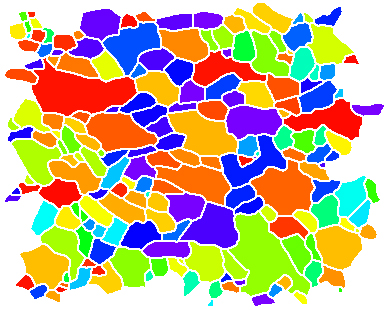
H - GRAIN ORIENTATION
The orientation of the grain is given by the orientation of the long axis of the best fit ellipse.
The angle of orientation runs from the positive x-axis (0 °) counterclockwise:
the positive y-axis = 90 °, the negative x-axis = 180°.
The grains are color-coded such that:
BLUE = grains with an orientation close to the positive x-axis (RIGHT)
GREEN = grains with an orientation close to the positive y-axis (UP)
RED = grains with an orientation close to the negative x-axis (LEFT)
The range of possible values is (0.00 ≤ angle ≤ 180.00).
|
|
|
|
Choosing min = 85 ° and max = 95 ° produces a red/blue map:
BLUE = grains with a RIGHT leaning orientation
GREEN = grains within 10 ° about the vertical direction
RED = grains with LEFT leaning orientation
Note that the darkest BLUE of the rainbow LUT is actually purple.
|


