< 

 Lazy Lighting 

 > 


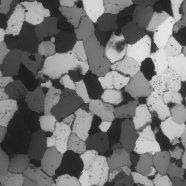
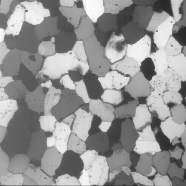
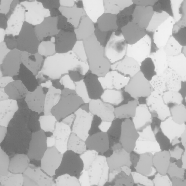
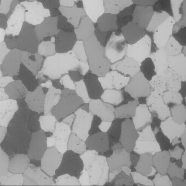
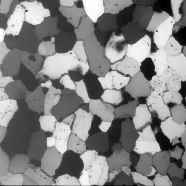
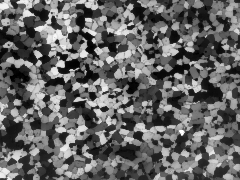
(a) oblique lighting


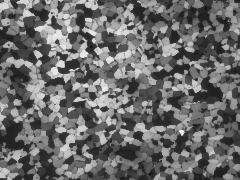
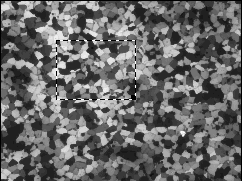
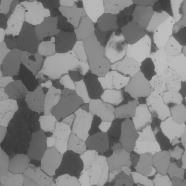
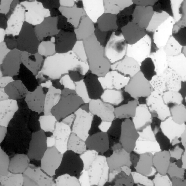
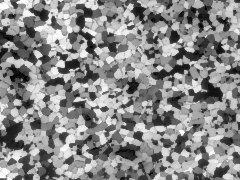
(b) central light dome (vignetting)


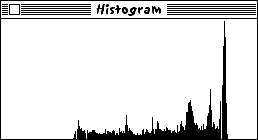
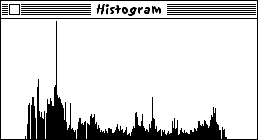
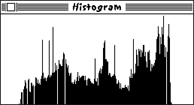
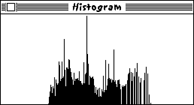
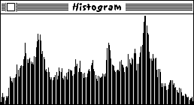
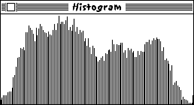
histogram of left side of (a)


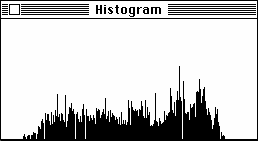
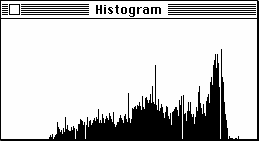
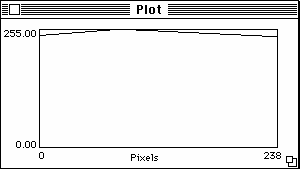
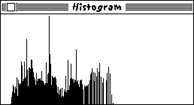
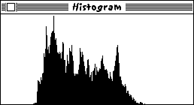
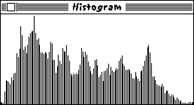
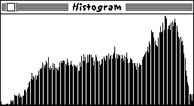
histogram of center of (b)


histogram of right side of (a)


histogram of upper right corner of (b)


INTRODUCTION

Lazy lighting is used to correct uneven brightness of micrographs caused by uneven lighting conditions in the optical microscope. Basis for the correction is the assumption that the average brighntess of the micrograph should be the same everywhere.


Lazy Lighting works both with Image SXM and NIH Image

The micrographs shown above (Black Hills quartzite, circular polarization) are examples of oblique lighting with brightness decreasing from left to right (a) and uneven brightness with a brighter part near the center and dark rims (b).

Situation (a) is caused by an incompletely removed compensator (partially obstructed light path), situation (b) was created by chosing the wrong condensor (condensor with too high an aperture, i.e., too small an area of even illumination).


 > 


GETTING STARTED

The object of this set of macros is to correct uneven background illumination.

  • Start Image SXM
  • Load Lazy Lighting macro (= text file)


ramp function

roof function


BACKGROUND CORRECTION

Two types of uneven lighting can be corrected:

  1. horizontal and vertical trends of brightness caused by oblique lighting
  2. central brightness caused by central bright light source

The first type is corrected by subtracting a horizontal or vertical ramp function from the image, the second typ is corrected by subtracting a horizontal and vertical "roof" function whose gables cross cut at the center of the bright spot.

The height of the ramp is determined by calculating the histogram of the "top" and "bottom strip" (width = image width, height = 1/6 of image height) or "left" and "right strip" (width = 1/6 image width, height = image height). The difference between the means of the top and bottom or left and right histograms yields the ramp height.

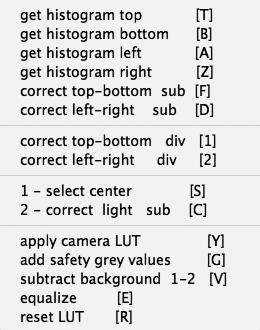
These histograms can be obtained by pressing [T], [B], [A], [Z] for top, bottom left and right histogram respectively.

A top-bottom trend is corrected by pressing [F] (for subtraction) or [1] (for division), a left-right trend is corrected by pressing [D] (for subtraction) or [2] (for division).


original


[D] after ramp correction


EXAMPLE OF RAMP CORRECTION

The ramp correction yields homogeneous brightness, but not necessarily homogeneous contrast. This due to the non-linearity of the recording equipment which produces lower contrast in the darker areas (see section "correction of contrast").


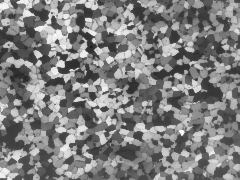
original


[S] selection of center of light dome


[C] after center correction


EXAMPLE OF ROOF CORRECTION

To correct the central brightness a region of interest, ROI, of 1/3 image width by 1/3 image height (1/9 of image area) is manually placed over the brightest part of the image, the brightest part being determined by visual inspection. The histogram of this area is calculated.

The four ramps are calculated by finding the difference between this mean and the means of the top, bottom, left and right histograms. The height of the top/bottom strips is now 1/9 of the image height, the width of the left/right strips 1/9 of the image width. (=to toparea = 1/9 of image area). The crossing of the roof lines is in the center of the ROI.

The ROI is created by pressing [S]. The ROI is moved (using the mouse) to the brightest area. After pressing [C], the correction is performed. The average brightness is constant all over the image.

As before, the contrast is not homogheneous. Towards the bottom right, the average contrast seems somewhat diminished. This due to the non-linearity of the recording equipment which produces lower contrast in the darker areas (see below).


original


histogram of original


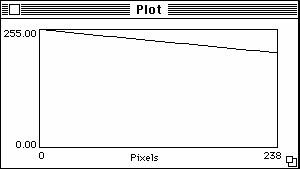
camera LUT


original with camera LUT applied


histogram of camera-corrected


CORRECTION OF CONTRAST

The problem of contrast inhomogeneity can be overcome if the initial image is corrected for the camera non-linearity (this requires the calibration of the camera). The calibration of the camera yields a look-up-table (LUT) which is used to linearize the image.


[G] grey value safety threshold added


histogram


[Y], [G], [D] ramp correction after camera correction


histogram


The greyvalue histogram is re-centered by adding a safety threshold value. This value is determined by splitting the diffferences (255-max. value) and (min. value - 0) evenlyabove and below the max. and min. values respectively.


with camera correction


[Y], [G], [D] and enhanced contrast


without camera correction


[D] only ramp correction, enhanced contrast


COMPARISON

Ramp correction with and without camera correction


with camera correction


without camera correction


[Y], [G], [S], [C] and enhanced contrast


[S], [C] only center correction, enhanced contrast


Roof correction with and without camera correction