< 

 Lazy CIP LUTs 

 > 


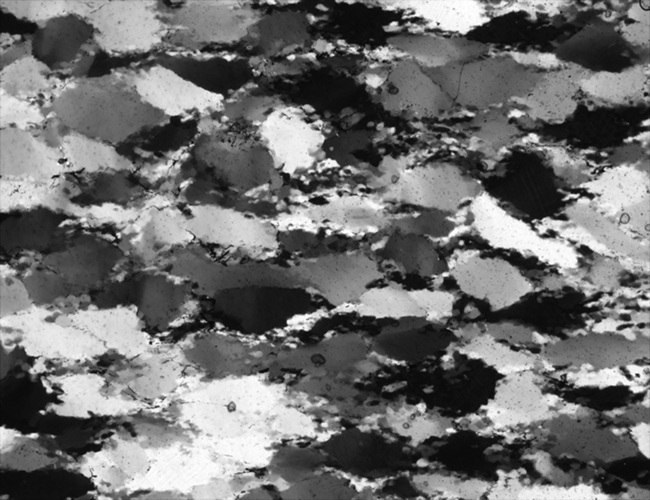
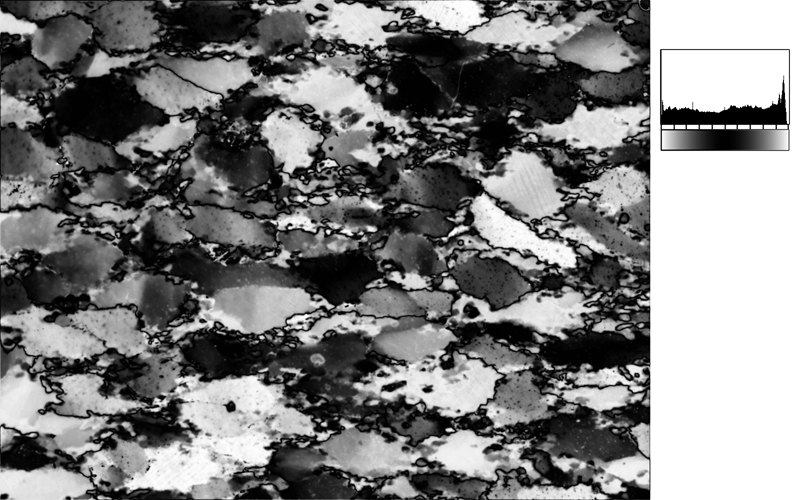
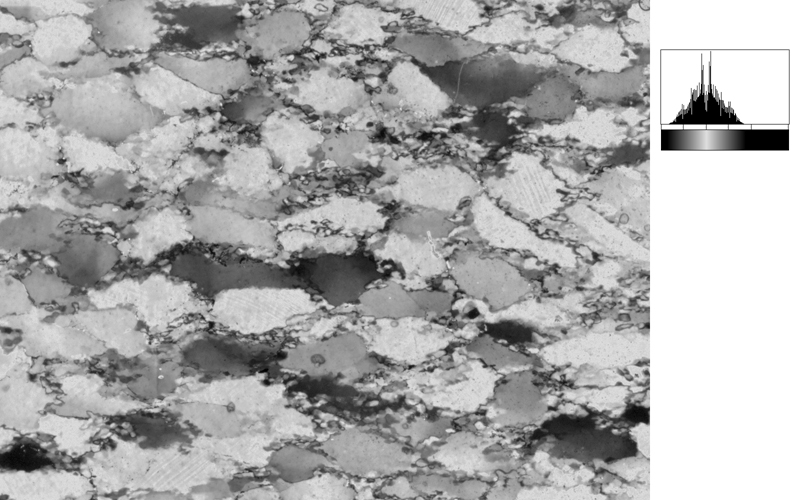
original view:

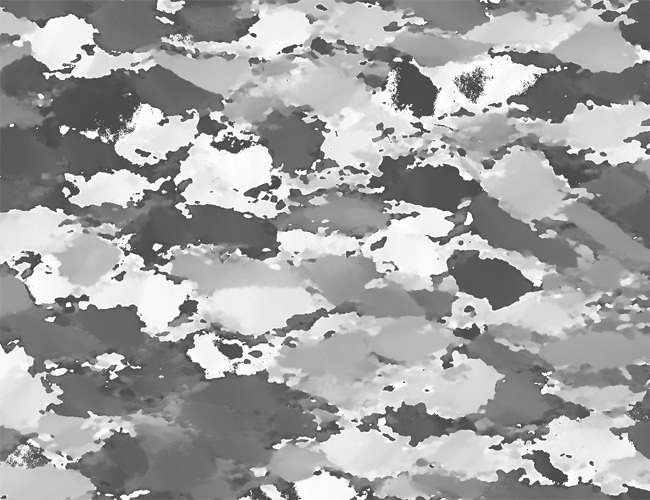
crossed polarization with lambda plate inserted


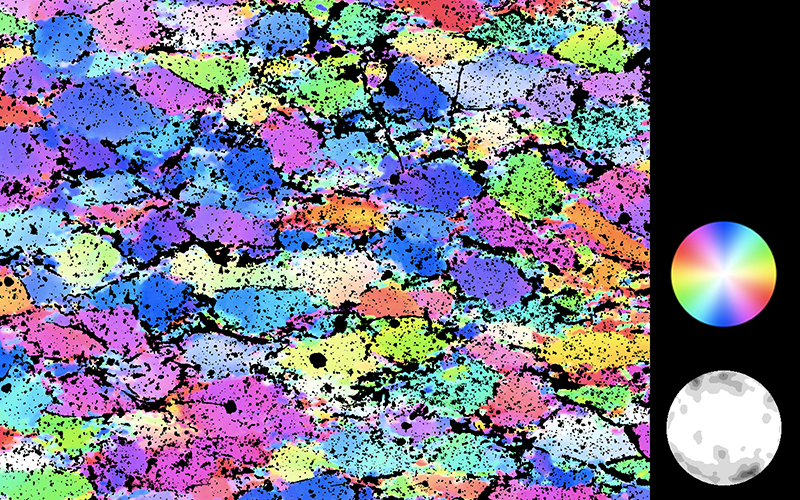
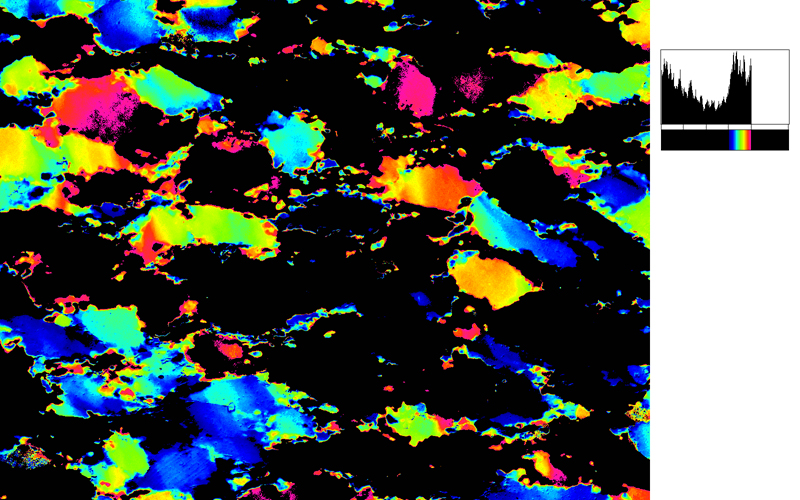
CIP result:

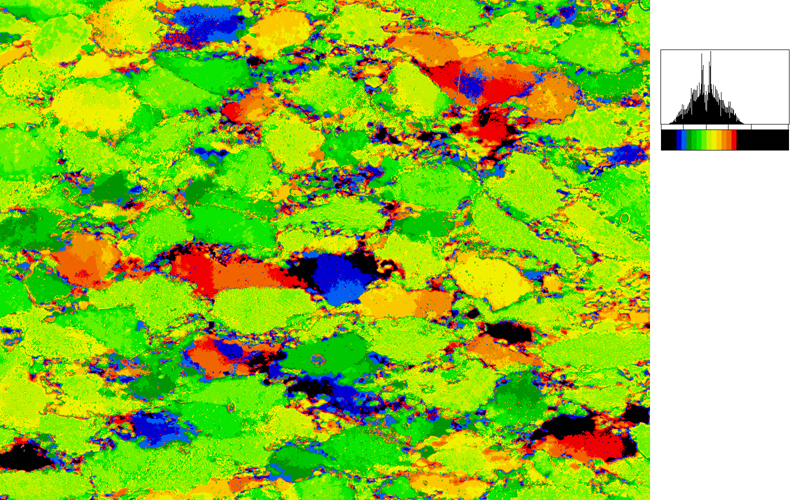
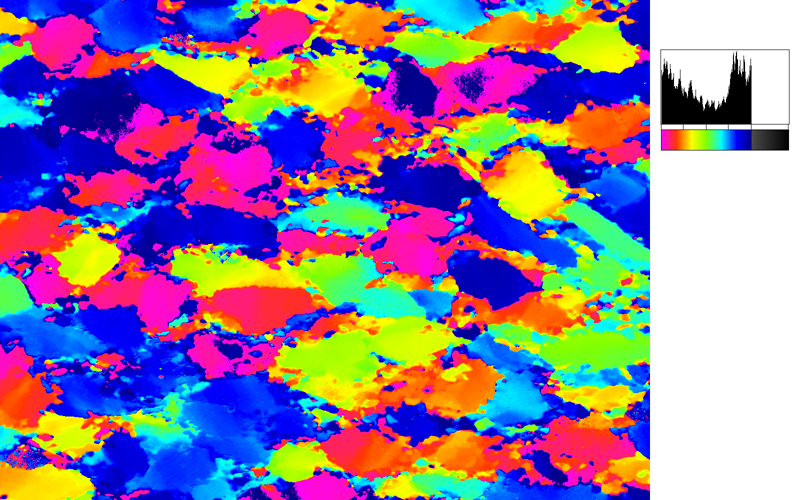
c-axis orientation image (COI) with Spectrum CLUT and pole figure


INTRODUCTION

The purpose of the CIP LUTs macros is to present better views of various CIP input and output images. The images are not changed during the application of the LUTs - the grayscale, i.e., original images can always be retrieved. In order to actually re-calculate/correct/improve the data, the Lazy View and Handle macro is required.

A quartz microstructure is shown at the top. Of this sample a CIP calculation is carried out. The CIP misorientation image (COI) with the stereographic CLUT and the pole figure is shown on the right.


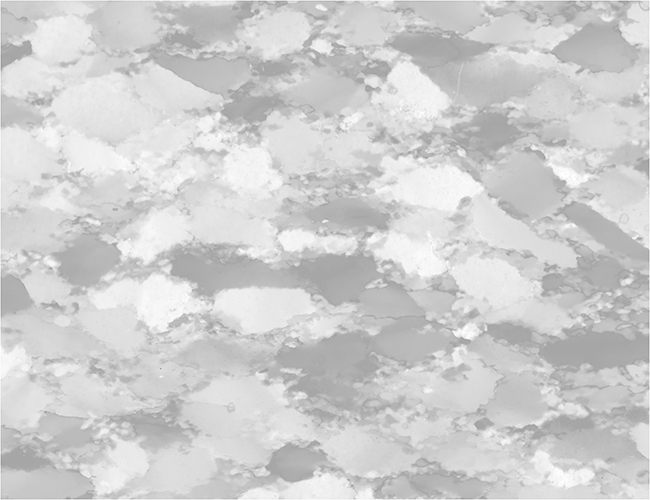
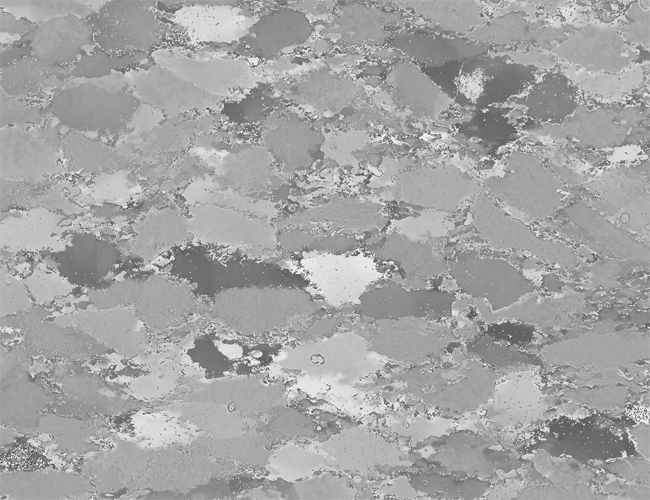
ROT000: rotation image at 0° rotation


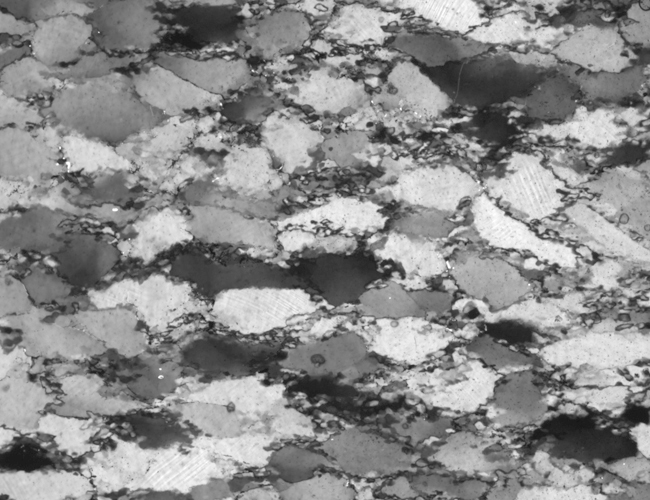
ROT000: presented as crossed polarization with lambda plate inserted


Two typical examples for CIP LUT applications are shown on the left:

Before beginning the CIP calculation, it may be useful to check input images. The rotation image (taken with crossed polarizers, the lambda plate inserted and a red interference filter applied) can be viewed with coloring similar to what one would observe when looking at the section without the interference filter. For a quick check, if the image is oriented correctly, it may be useful to use [+] or [-] to convert a monochrome rotation image of an optically positive or a negative mineral (quartz or calcite, respectively) to a color image showing - at least in an approximate manner - the blue and the yellow orientaions. (Compare with original).

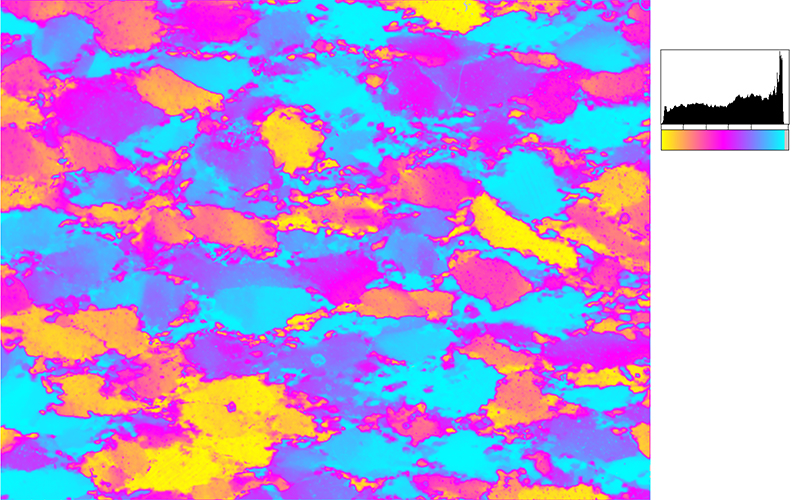
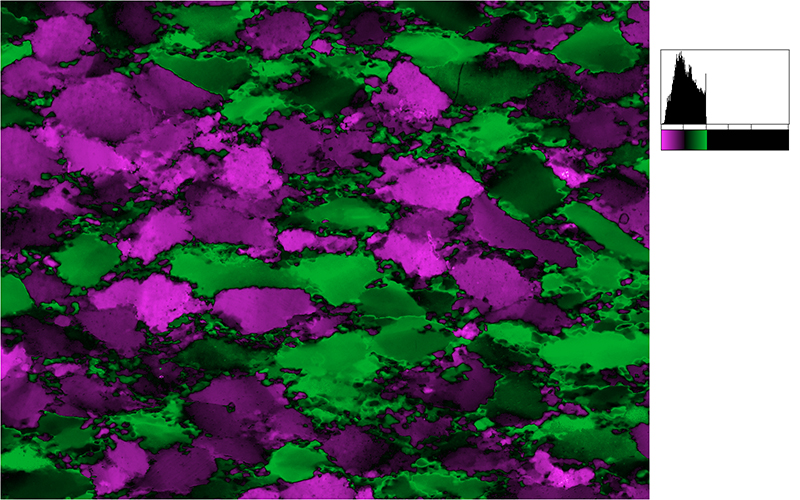
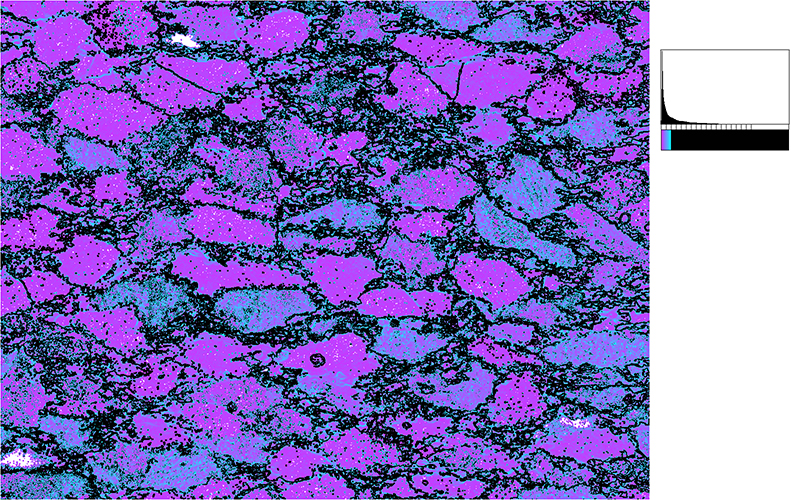
After the CIP calculation, the different result files have to be evaluated. Here, the misorientaion file w/r to North is shown. The values span a range of (0° ≤ angle ≤ 180°). Grains with c-axes pointing due North (y-direction of the image) have a misorientation of 0°, grains with c-axes in the plane normal to North have a misorientation of 90°. - With color coding, the grains sub-/parallel to North are purple, those in the plane normal to North are green.


misN: misorientation image w/r North


color coded version of misN


After the CIP calculation, the different result files have to be evaluated. Here, the misorientaion file w/r to North is shown. The values span a range of (0° ≤ angle ≤ 180°). Grains with c-axes pointing due North (y-direction of the image) have a misorientation of 0°, grains with c-axes in the plane normal to North have a misorientation of 90°. - With color coding, the grains sub-/parallel to North are purple, those in the plane normal to North are green.


GETTING STARTED

Load Lazy CIP LUTs macro.

The macros are grouped in seven groups depending on which orientation images are to be visualized:


  • handling images: import CIP images - prepare stack - prepare scales and histograms
  • ROT - recalculate polarization images from rotation images
  • INC - color code inclination images
  • AZI - color code azimuth images
  • MOI - color code misorientation images
  • OGI - color code orientation gradient images
  • general LUTs


ROT000: rotation image at 0° rotation


ROT000: presented as crossed polarization with lambda plate inserted

A quartz microstructure is shown at the top. Of this sample a CIP calculation is carried out. The CIP misorientation image (COI) with the stereographic CLUT and the pole figure is shown on the right. >


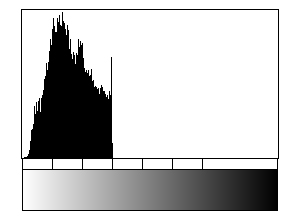
histogram and grayscale with ticks at 30 GV intervals

NOTE:

for AZI, INC, MOI: 30 GV = 30 °

for OGI: 30 GV = 15 °


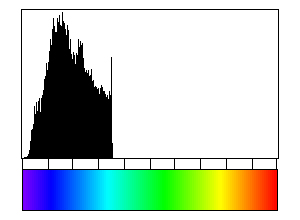
histogram and grayscale (Rainbow LUT loaded) with ticks at 10 % intervals


PREPARING NICE IMAGES AND STACKS

The first group of macros is intended to open images, prepare stacks (e.g., of misorientation images), to achieve a minimal layout, to insert histograms and gray scales.

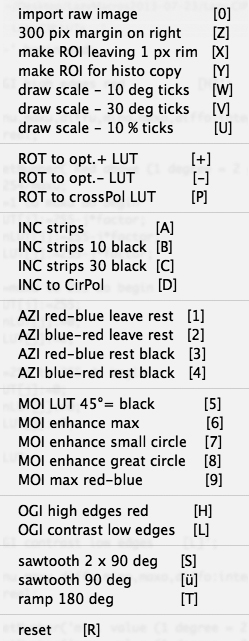
  • [0] import raw images
  • [Z] a white margin of 300 px width is added (intended for stacks only)
  • [X] creates region of interest leaving a rim of 1 px width (useful for misorientation images which are not defined at the border)
  • [Y] draws a box in the 300 px margin and a ROI such that the histogram of the image can be copied into it
  • [W] draws a gray scale underneath the histogram with ticks corresponding to 10°/10 GV intervals
  • [V] same as [W] with ticks at 30°/30 GV intervals
  • [U] same as [W] with ticks at 10 % intervals (= 25.5 GV)


original RGB: quartzite with crossed polarizers and lambda plate inserted


simulated version: using rotation image at 0° rotation (gamma = 2.00 applied)


rotation image at 0° rotation
(gamma = 2.00 applied)


simulated cross polarization


USING ROTATION IMAGES

Rotation images are CIP input images.

It is sometimes useful to check if the input is what we think it is... One of the quickest checks is to see which grains are blue and which are yellow (crossed polarizers and wave plate). From the monochrome input images an approximate color image can be generated that simulates the color impression we would get if we used the microscope.

  • [+] converts optically positive materials such as quartz
  • [-] converts optically negative materials such as calcite, ice, norcamphor
  • [P] creates a very crude simulation of an image taken under cross polarization


inclination image


[C] → 10° striping. - Note: orientations close to the image normal appear black, those close to the image plane appear green.


circular polarization image
(gamma = 1.60 applied)


[D] → simulated circular polarization using inclination image


USING INCLINATION IMAGES

Inclination images are CIP output images.

Grayscale inclination images are difficult to interprete because inclination runs from 0° (up) to 180° (down) with the horizontal (i.e., the image plane) being 90°

  • [A] color codes inclination in 10° strips using the Rainbow LUT, from BLUE (=up) to RED (=down). Grayvalues > 180 are unchanged.
  • [B] same as [A] setting grayvalues > 180 to black.
  • [C] color codes inclination between 30° and 15o° leaving orientations within a 30° cone about the image normal black
  • [D] applies a LUT to the INC image such that it looks like the cirpol input image (circular polarization).


azimuth image


[4] → blue to red for (135° ≤ azi ≤ 180 °) - remaining orientations black.


[1] → red to blue for (0° ≤ azi ≤ 180 °)


USING AZIMUTH IMAGES

Azimuth images are CIP output images.

To highlight preferred orientations, two basic LUTs for azimuth images are provided: [1] and [3] with descending colours (red to blue), and [2] and [4] with increasing colours (blue to red) for increasing values of azimuth, i.e., orientations from North clockwise to South.

Any range of azimuths up to 180° can be selected between -180° and +180°.

  • [1] increasing LUT. Grayvalues outside selected range are left unchanged
  • [2] decreasing LUT. Grayvalues outside selected range are left unchanged
  • [3] increasing LUT. Grayvalues outside selected range are set to black
  • [4] decreasing LUT. Grayvalues outside selected range are set to black


misN: misorientation image w/r North


plane normal to North (60° - 90°) highlighted


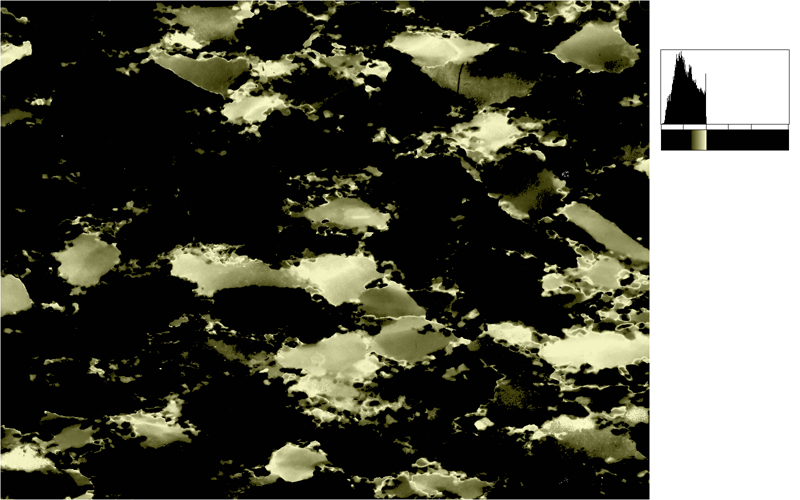
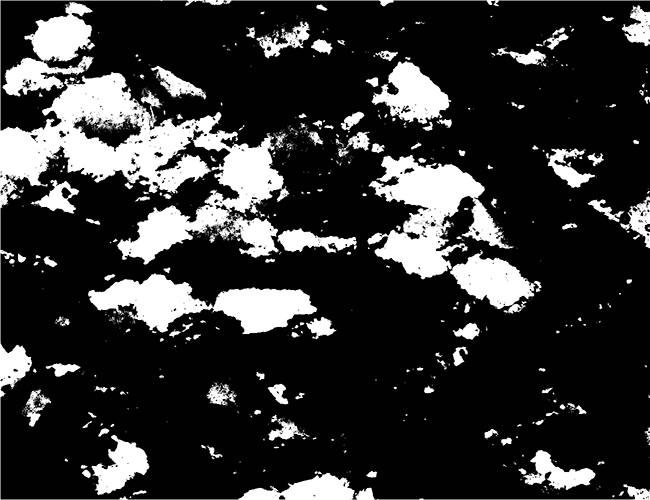
bitmap of misorientations within 30° cone about North


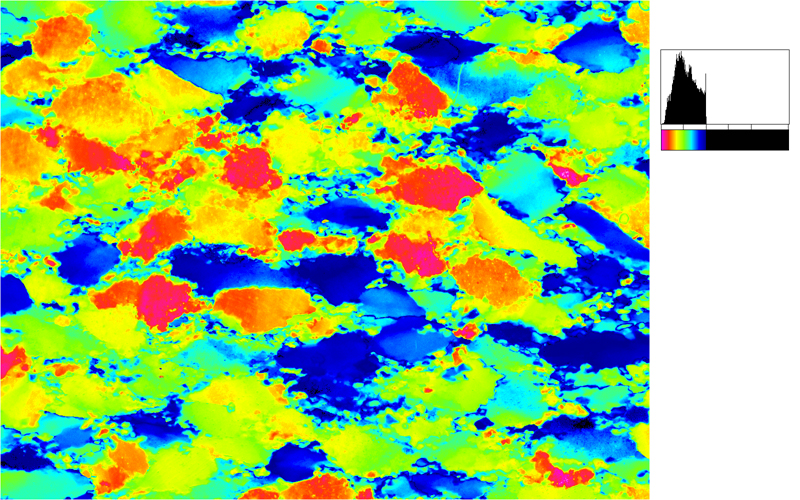
color coded version of misN: red = North


USING MISORIENTATION IMAGES

Misorientation images are CIP output images.

To highlight certain misorientations, a number of LUTs images are provided:

Any range of azimuths up to 180° can be selected between -180° and +180°.

  • [5] misorientation ≤ 45° are purple, those ≥ 45° are green
  • [6] misorientations about reference direction are highlighted
  • [7] misorientations in cone about reference direction are highlighted
  • [8] misorientations in plane normal to reference direction are highlighted
  • [9] misorientations are color coded: max=red


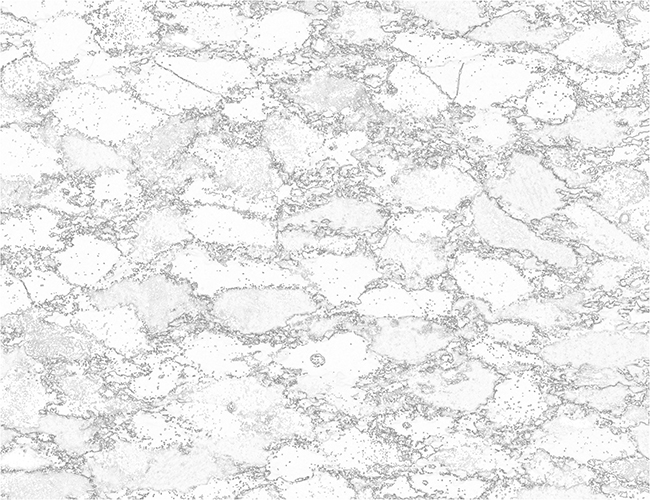
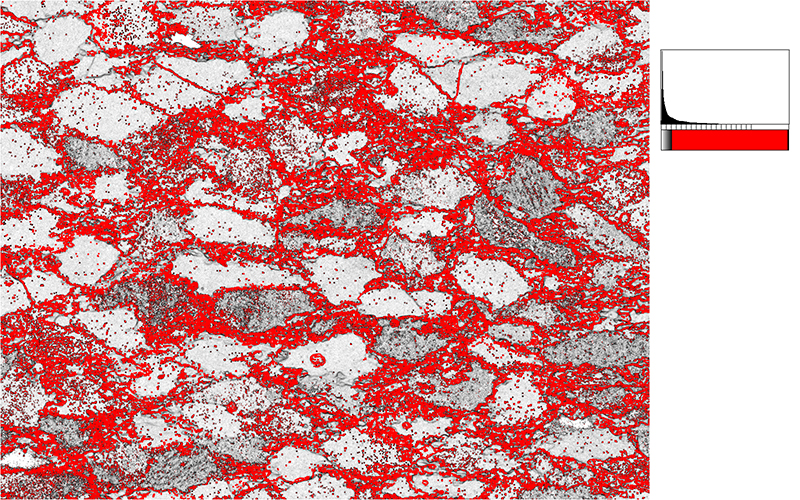
orientation gradient image:

average of 8 neighbors


low values (≤ 10° = internal structure of grains) highlighted


high values (> 11° = grain boundaries) highlighted


USING ORIENTATION GRADIENT IMAGES

Orientation gradient images are CIP output images. Four different types are available:

  • w/r to 2 neighbors
  • w/r to 4 neighbors
  • w/r to 8 neighbors
  • w/r to 8 neighbors (maximum value)

For better resolution, the average (or maximum) gradient is recorded such that 1° = 2 GV.

  • [L] low gradients (insides of grains) are highlighted
  • [H] high gradients (grain boundaries) are highlighted